The imshow wrapper#
To simplify the use of Matplotlib’s imshow function, teareduce includes a wrapper that automatically adds a colorbar. This is especially useful when analyzing astronomical images. Additionally, for wavelength-calibrated spectroscopic exposures, it allows the wavelength scale to be displayed on the horizontal axis.
from astropy.io import fits
import astropy.units as u
import matplotlib.pyplot as plt
import teareduce as tea
Download the required file
tea.get_cookbook_file('notebooks/aux/imshow/wcftdz_45330.fits')
File wcftdz_45330.fits already exists locally. Skipping download.
We read the sample image.
with fits.open('wcftdz_45330.fits') as hdul:
    header = hdul[0].header
    data = hdul[0].data
This image is wavelength calibrated.
for key in ['CRPIX1', 'CRVAL1', 'CDELT1', 'CUNIT1']:
    print(f'{key}: {header[key]}')
CRPIX1: 1.0
CRVAL1: 6.502e-07
CDELT1: 3.9e-11
CUNIT1: m
Simple usage#
With a single instruction we can display the data array, including a colorbar and automatic labels. For that purpose we can employ the auxiliary imshowme() function.
tea.imshowme(data)
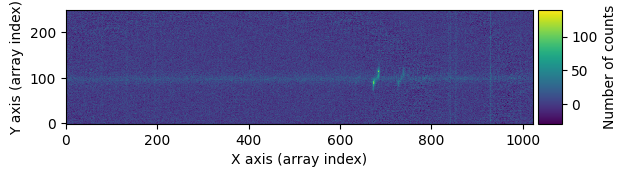
This function is actually calling the tea.imshow() function described next by setting default values for the Figure and Axis objects.
Setting the figure size#
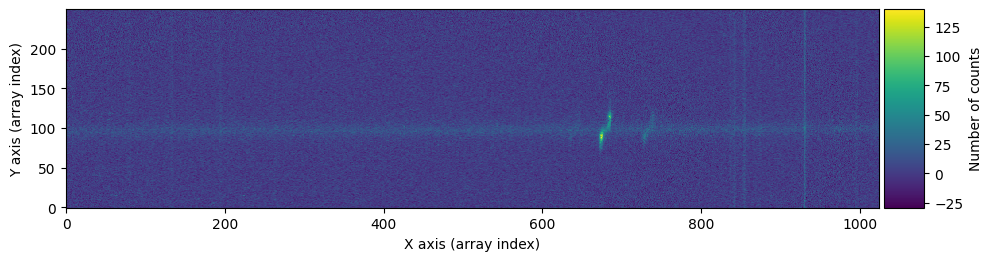
It is possible to transfer user-defined Figure and Axis instances.
fig, ax = plt.subplots(figsize=(10, 5))
tea.imshow(fig, ax, data)
plt.tight_layout()
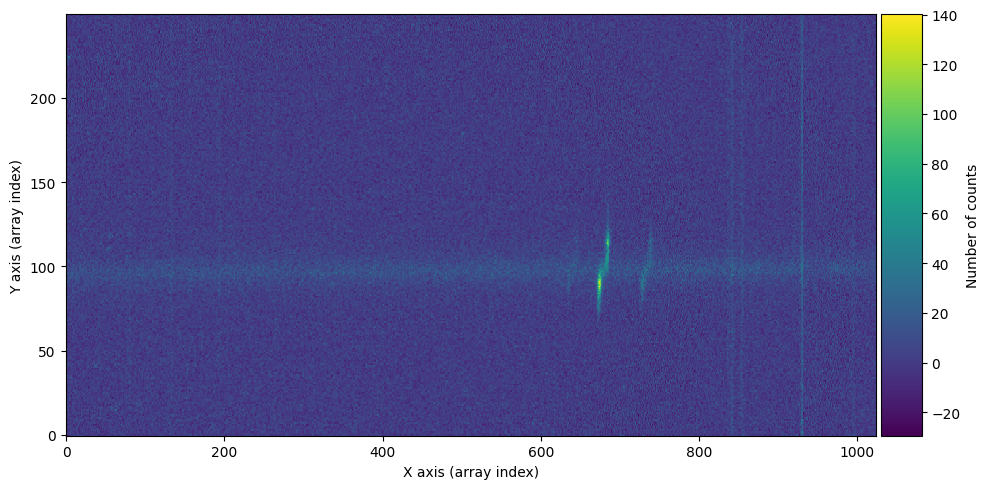
By default, the image is displayed using aspect='equal'. This can be easily modified:
fig, ax = plt.subplots(figsize=(10, 5))
tea.imshow(fig, ax, data, aspect='auto')
plt.tight_layout()
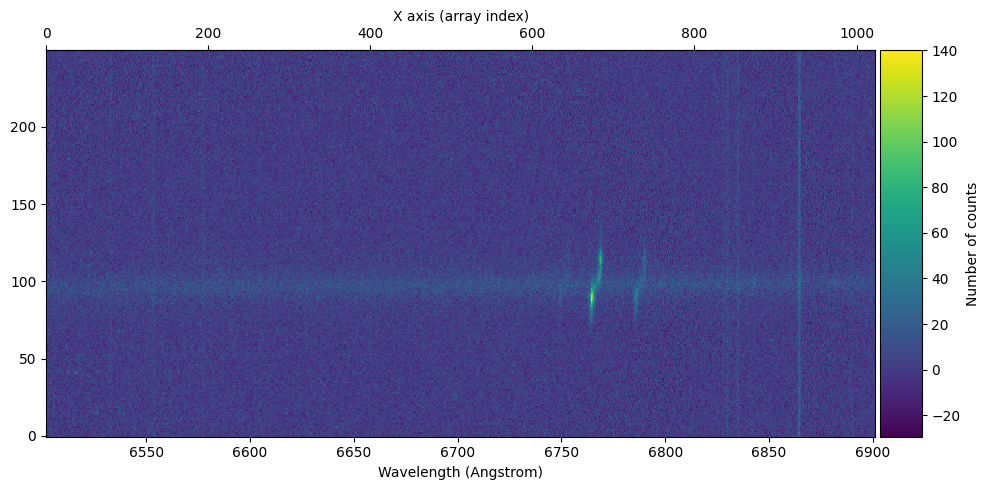
Displaying the wavelength#
For images calibrated in wavelength, we can specify the keywords that contain the corresponding information. This allows the figure to display a wavelength scale on the bottom horizontal axis, showing in this case the array index scale on the top horizontal axis. The units on the wavelength axis may differ from those used in the wavelength calibration.
cunit1 = u.Unit(header['cunit1'])
crpix1 = header['crpix1'] * u.pix
crval1 = header['crval1'] * cunit1
cdelt1 = header['cdelt1'] * cunit1 / u.pix

print(f'{cunit1=}\n{crpix1=}\n{crval1=}\n{cdelt1=}')
cunit1=Unit("m")
crpix1=<Quantity 1. pix>
crval1=<Quantity 6.502e-07 m>
cdelt1=<Quantity 3.9e-11 m / pix>
fig, ax = plt.subplots(figsize=(10, 5))
tea.imshow(fig, ax, data,
           crpix1=crpix1,
           crval1=crval1,
           cdelt1=cdelt1,
           cunit1=cunit1,
           cunitx=u.Angstrom
          )
plt.tight_layout()
Function documentation#
Note that keyword arguments not defined in the tea.imshow() are passed to the original Matplotlib imshow() function.
help(tea.imshow)
Help on function imshow in module teareduce.imshow:

imshow(
    fig=None,
    ax=None,
    data=None,
    ds9mode=False,
    crpix1=1,
    crval1=None,
    cdelt1=None,
    cunit1=None,
    cunitx=Unit("Angstrom"),
    xlabel=None,
    ylabel=None,
    title=None,
    colorbar=True,
    cblabel='Number of counts',
    return_objs=True,
    **kwargs
)
    Call imshow() with color bar and default labels.

    If crpix1, crval1, cdelt1 and cunit1 are not None, a wavelengh
    scale is also displayed. In this case, the colorbar is not shown
    because there is a conflict (to be solved).

    Parameters
    ----------
    fig : matplotlib.figure.Figure
        Instance of Figure.
    ax : matplotlib.axes.Axes
        Instance of Axes.
    data : numpy array
        2D array to be displayed.
    ds9mode : bool
        If True, the extent parameter is set to
        [0.5, NAXIS1+0.5, 0.5, NAXIS2+0.5]
        to mimic the DS9 display.
    crpix1 : astropy.units.Quantity
        Float number providing the CRPIX1 value: the reference pixel
        for which CRVAL1 is given.
    crval1 : astropy.units.Quantity
        Float number providing the CRVAL1 value: wavelength at the
        center of the first pixel.
    cdelt1 : astropy.units.Quantity
        Float number providing CDELT1 value: wavelength increment
        per pixel.
    cunit1 : astropy.units.Quantity
        Float number providing CUNIT1: the units employed in the
        wavelength calibration.
    cunitx : astropy.units.Quantity
        Units employed to display the wavelength scale. It can be
        different from cunit1.
    xlabel : str or None
        X label.
    ylabel : str or None
        Y label.
    title : str or None
        Plot title.
    colorbar : bool
        If True, display color bar.
    cblabel : str
        Color bar label.
    return_objs : bool
        If True, return AxesImage, color bar Axes and Colorbar
        instances.
    **kwargs : dict
        Additional parameters passed to imshow().

    Return
    ------
    img : matplotlib AxesImage
        Instance returned by ax.imshow()
    cax : matplotlib.axes.Axes or None
        Instance of Axes where the color bar is drawn, or None if
        colorbar is False.
    cbar : matplotlib.colorbar.Colorbar or None
        Instance of Colorbar, or None if colorbar is False.